IRIDIUM 90 reentry prediction
Please, see here for the calculations details.
Simulation date: 2019-01-23
Atmosphere model: NRLMSISE-00, data file: 2019 Jan 23 10:00:02.44
Gravity model: SGG-UGM-1 truncated to degree and order 15
Reentry date: 2019-01-23 21:26 (averaged the newest 8 TLEs)
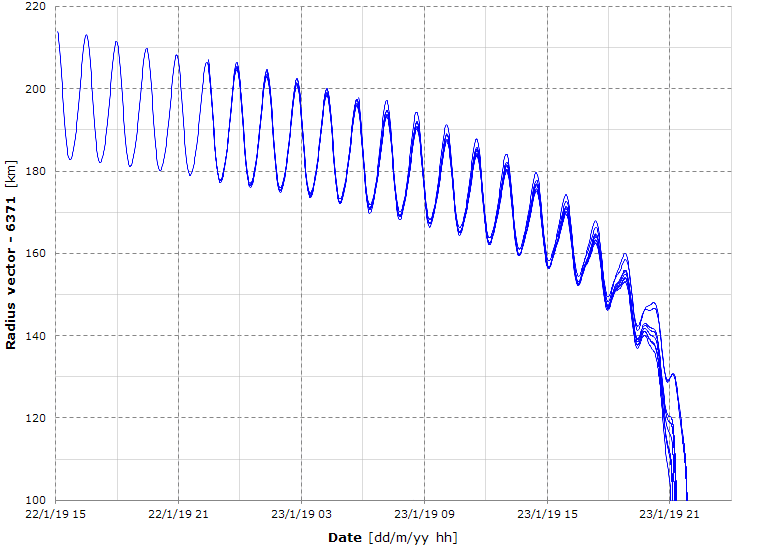
Here's the predicted radius vector propagated from the newest 8 TLEs.
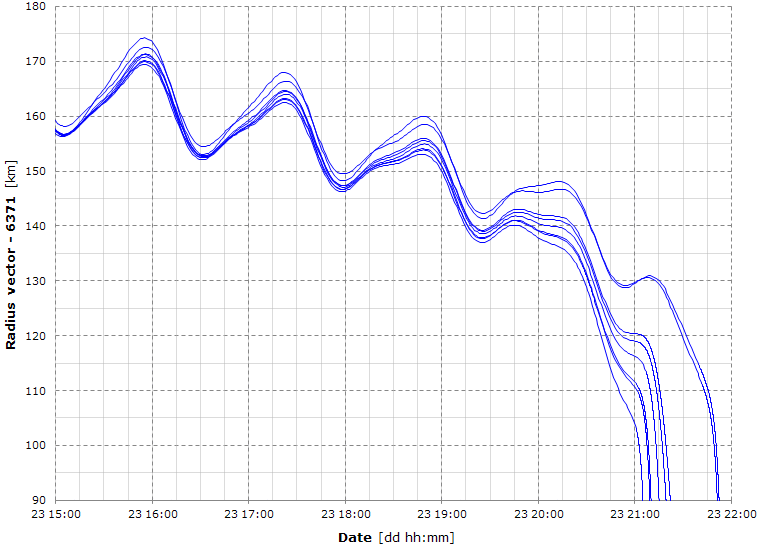
Here's the detailed view of the above graph (notice that this is the radius vector, not the altitude).
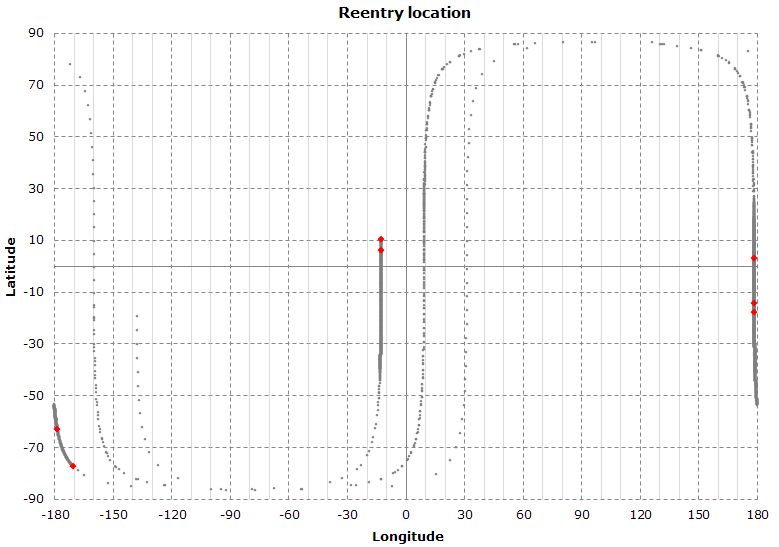
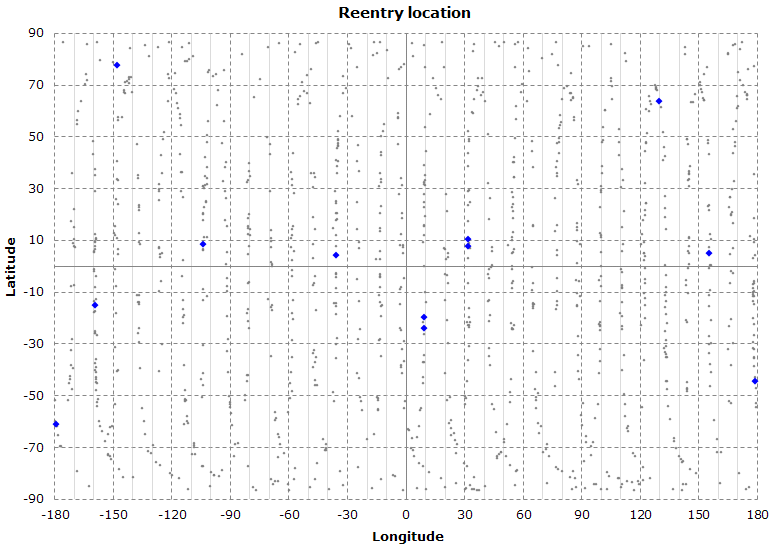
The graph shows the last orbit obtained from the newest 8 TLEs.
The red dots represent the reentry locations.
| TLE epoch |
Reentry date [TDT] |
Lat |
Lon |
| 19022.56628046 | 2019-01-23 21:07 | 2.9 | 178.6 |
| 19022.87288941 | 2019-01-23 21:12 | -17.8 | 178.6 |
| 19022.87289109 | 2019-01-23 21:11 | -14.4 | 178.6 |
| 19022.87289782 | 2019-01-23 21:23 | -62.9 | -178.4 |
| 19022.93415931 | 2019-01-23 21:53 | 6.0 | -12.5 |
| 19023.11784341 | 2019-01-23 21:26 | -77.5 | -170.1 |
| 19023.17902546 | 2019-01-23 21:55 | 10.3 | -12.5 |
| 19023.36241589 | 2019-01-23 21:18 | -40.8 | 179.1 |
| Average: | 2019-01-23 21:26 | | |
Simulation date: 2019-01-22
Atmosphere model: NRLMSISE-00, data file: 2019 Jan 22 16:00:03.08
Gravity model: SGG-UGM-1 truncated to degree and order 15
Reentry date: 2019-01-23 23:09 (averaged the newest 7 TLEs)
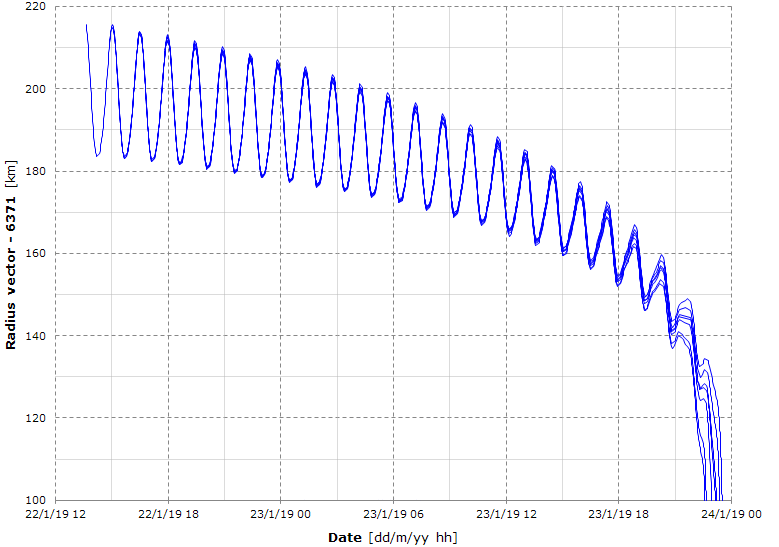
Here's the predicted radius vector propagated from the newest 7 TLEs.
The graph shows the last orbit obtained from the newest 7 TLEs.
The red dots represent the reentry locations.
| TLE epoch |
Reentry date [TDT] |
Lat |
Lon |
| 19021.58287 | 2019-01-23 23:26 | 24.0 | -34.5 |
| 19021.70595 | 2019-01-23 23:37 | 69.6 | -29.4 |
| 19022.07495 | 2019-01-23 23:18 | -6.3 | -34.6 |
| 19022.19786 | 2019-01-23 23:17 | -13.6 | -34.6 |
| 19022.38213 | 2019-01-23 23:08 | -45.6 | -35.4 |
| 19022.50491 | 2019-01-23 22:39 | -13.0 | 156.5 |
| 19022.56628 | 2019-01-23 22:44 | -33.5 | 156.8 |
| Average: | 2019-01-23 23:09 | | |
Simulation date: 2019-01-21
Atmosphere model: NRLMSISE-00, data file: 2019 Jan 21 13:00:02.50
Gravity model: SGG-UGM-1 truncated to degree and order 15
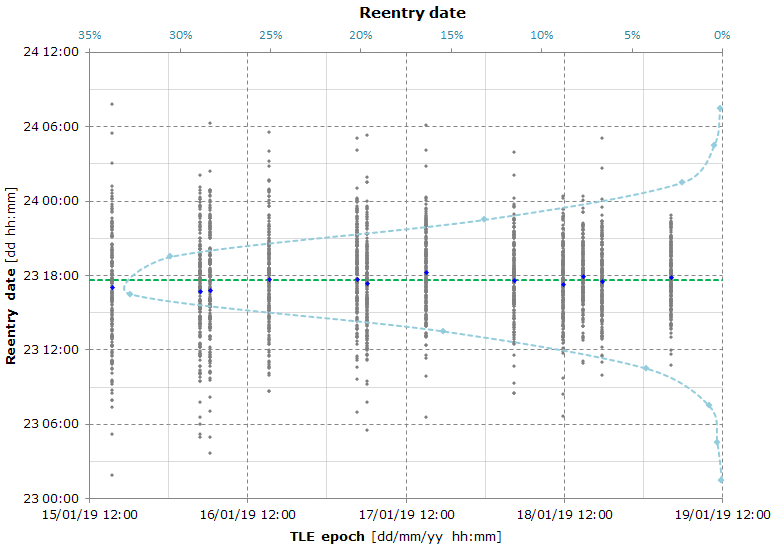
Reentry date: 2019-01-23 20:32 ± 9 hours @ 95% confidence level (2019-01-23 11:21 ÷ 2019-01-24 05:42)
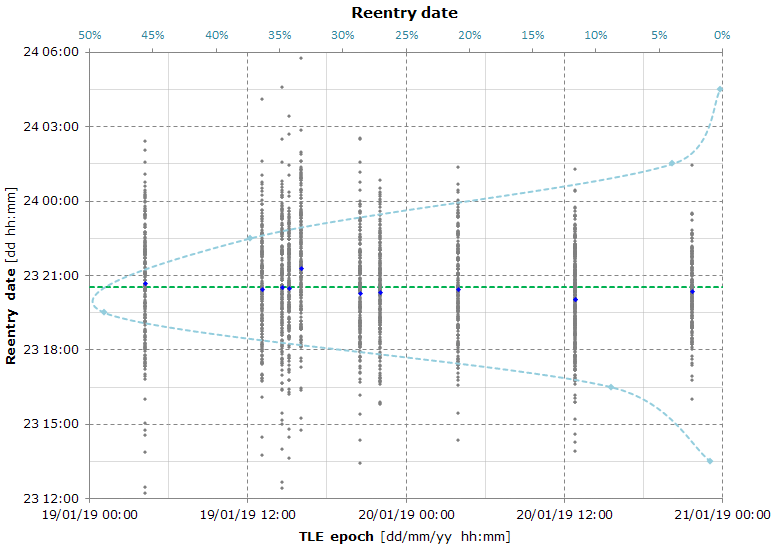
The graph is the result of a Monte Carlo simulation used to calculate the reentry date and the reentry location.
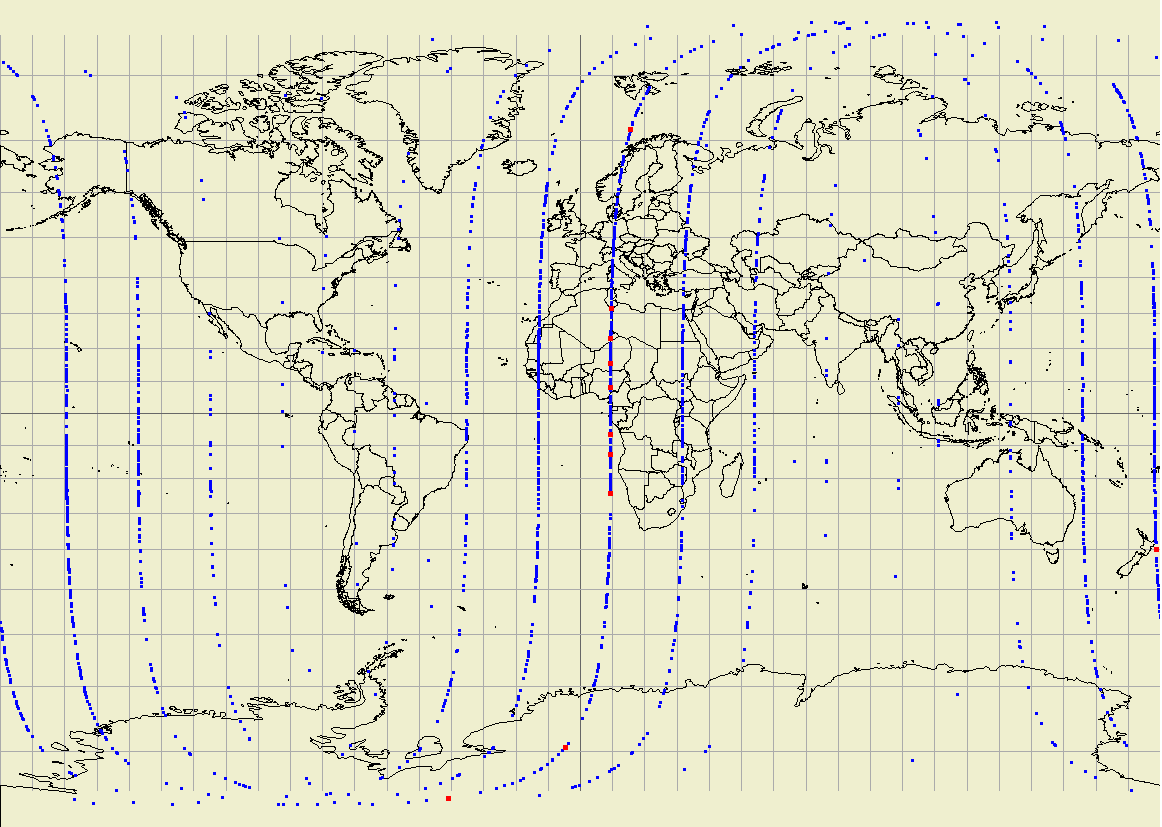
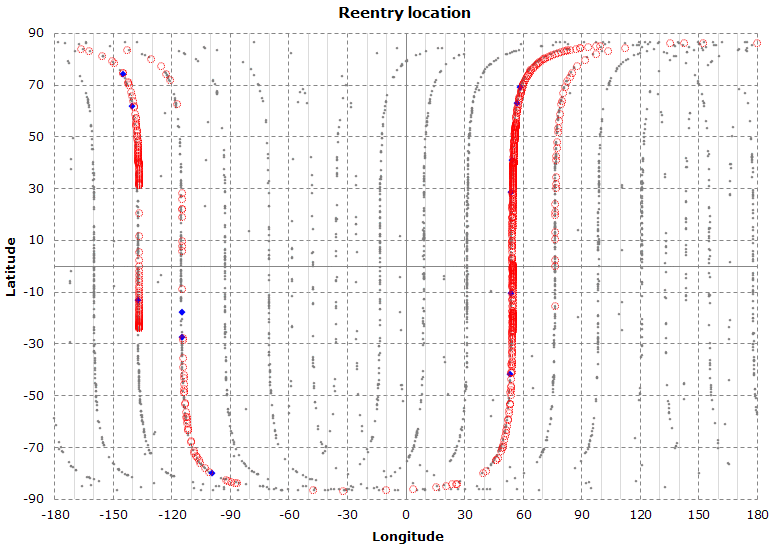
The following map shows the most likely reentry locations. The red dots represent the original (unmodified) TLEs.
The first reentry date obtained from the original TLEs is Gen 23 20:02 UTC; the corresponding red dot is located at 85.8 S, 41 W; then there are 9 red dots along the ascending orbit over Africa and Europe (the northernmost point represents a reentry time equal to 20:42); the last point of that orbit is located at 40 S, 179 E and the reentry time is 21:18.
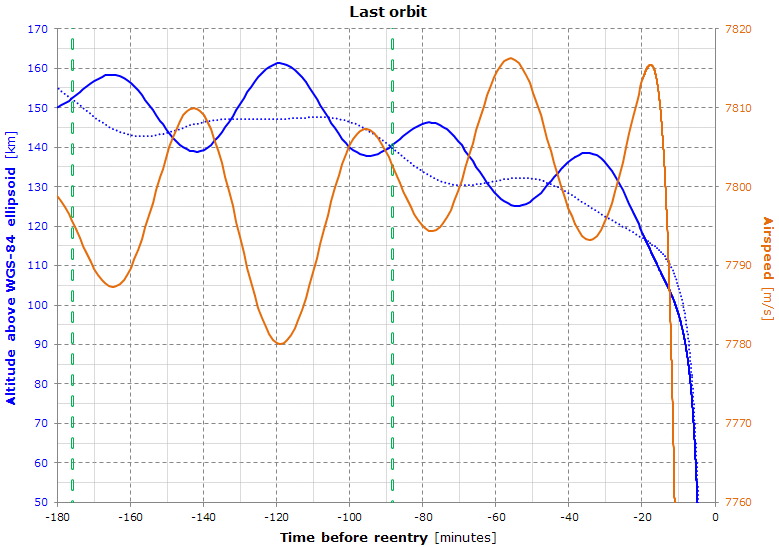
Here's the shape of the predicted last orbit and the corresponding airspeed (corotating atmosphere assumed).
The vertical green lines represent one orbit: the last orbit starts about 88 minutes before reentry and the penultimate orbit starts about 176 minutes before reentry.
The dotted blue plot represents the radius vector minus 6371 km.
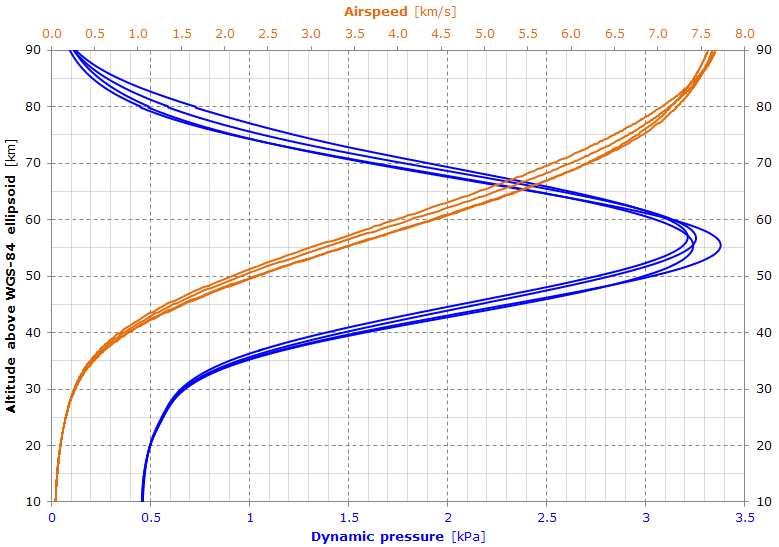
The graph shows a possible reentry profile of the dynamic pressure and satellite airspeed (corotating atmosphere assumed) obtained from the 4 newest TLEs.
We can see a small dynamic pressure peak; the reason is that the ballistic coefficient is small (its best fit value for this simulation is about 46 kg/m
2).
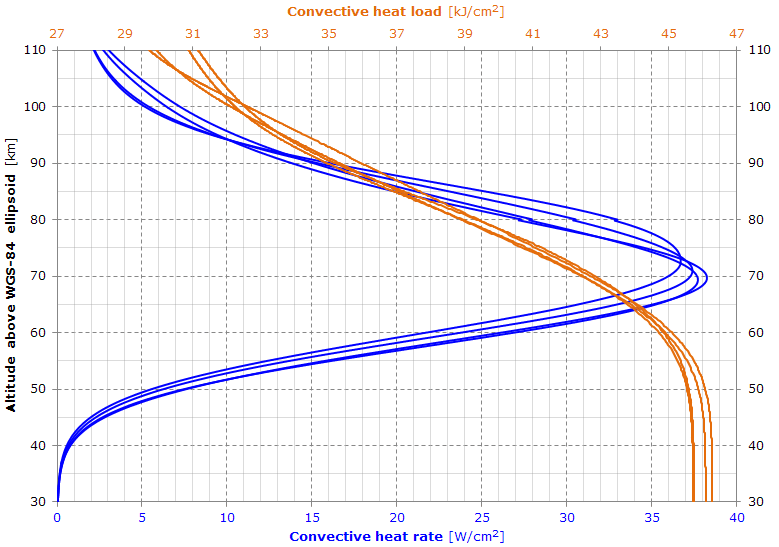
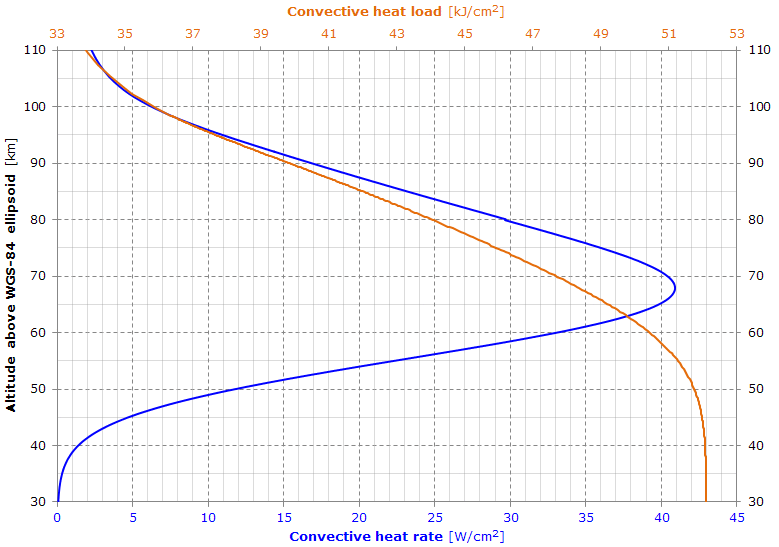
Here's the approximate stagnation point heat development during reentry.
Simulation date: 2019-01-19
Atmosphere model: NRLMSISE-00, data file: 2019 Jan 19 07:00:02.67
Gravity model: SGG-UGM-1 truncated to degree and order 15
Reentry date: 2019-01-23.7 ± 15 hours @ 95% confidence level (2019-01-23.1 ÷ 2019-01-24.4)
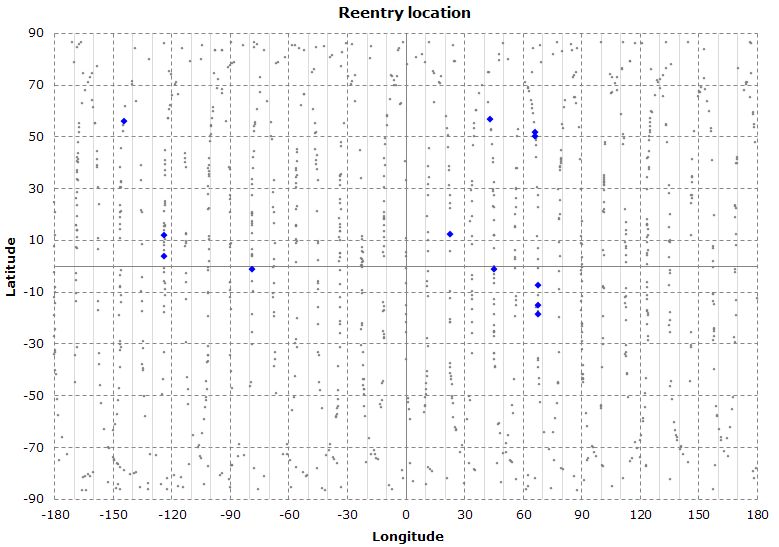
The graph is the result of a Monte Carlo simulation used to calculate the reentry date and the reentry location.
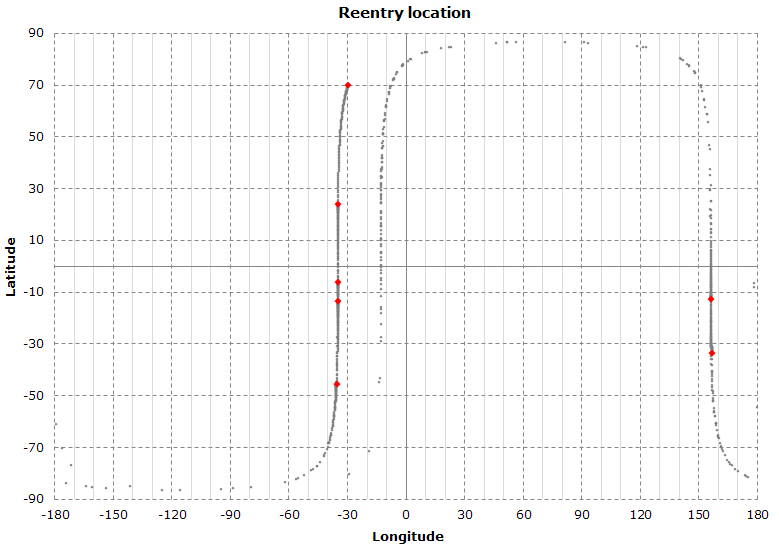
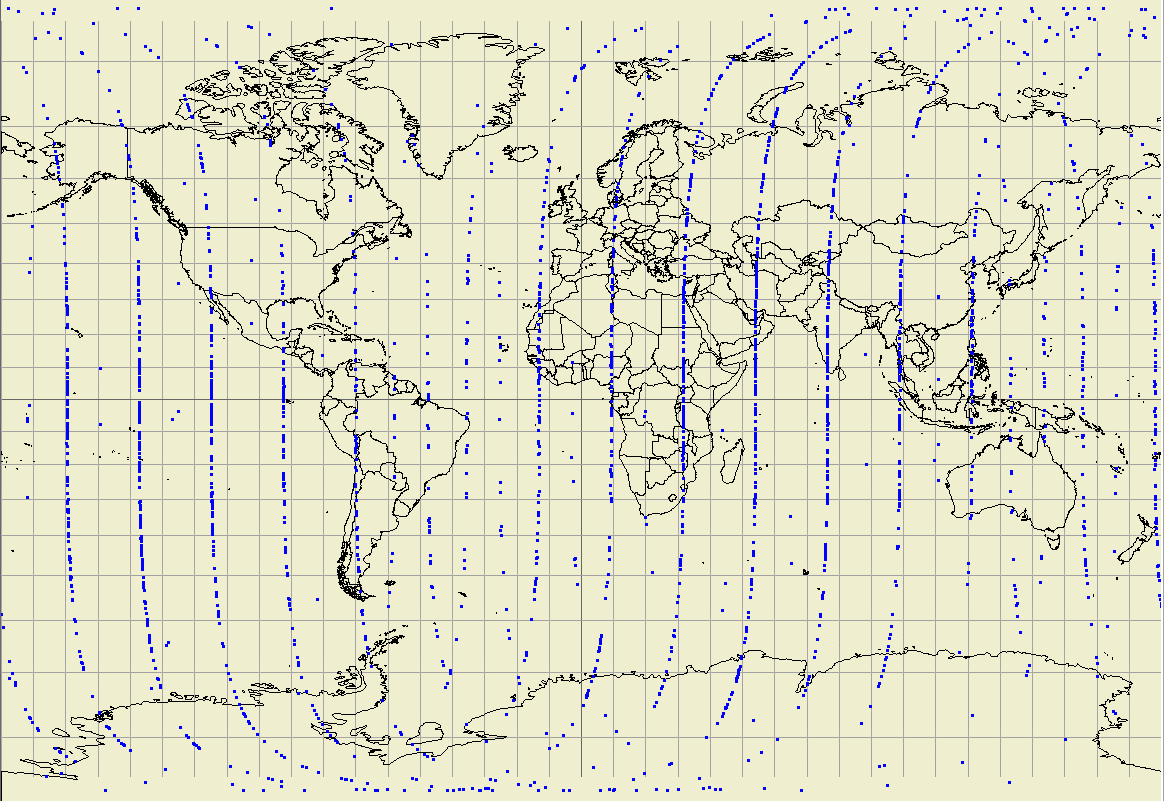
The graph shows the predicted reentry location.
The red circles highlight the most likely reentry orbit arcs.
Here's a map of the most likely reentry locations:
Simulation date: 2019-01-12
Atmosphere model: NRLMSISE-00, data file: 2019 Jan 12 07:00:02.92
Gravity model: SGG-UGM-1 truncated to degree and order 15
Reentry date: 2019-01-24.1 ± 1.4 days @ 95% confidence level (2019-01-22.7 ÷ 2019-01-25.6)
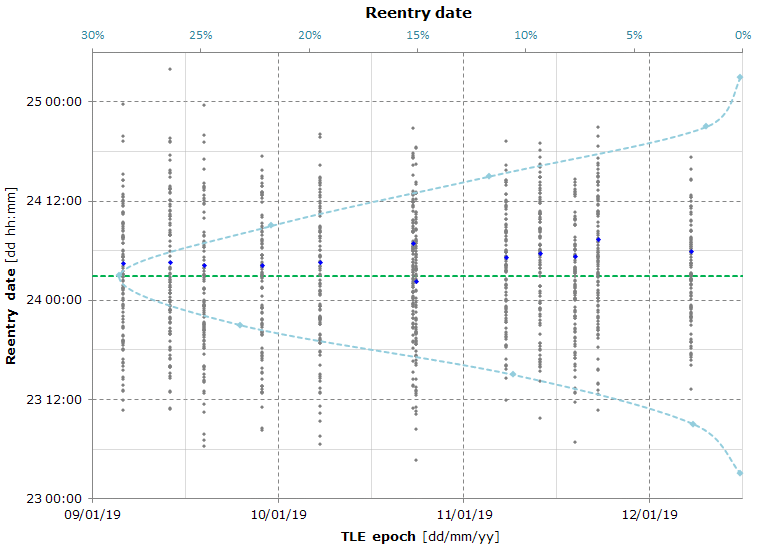
The graph is the result of a Monte Carlo simulation used to calculate the reentry date and the reentry location.
The graph shows the predicted reentry location for each Monte Carlo simulation.
Simulation date: 2019-01-03
Atmosphere model: NRLMSISE-00, data file: 2019 Jan 03 10:00:02.00
Gravity model: SGG-UGM-1 truncated to degree and order 15
Reentry date: 2019-01-21.9 ± 1.9 days @ 95% confidence level (2019-01-20.0 ÷ 2019-01-23.7)
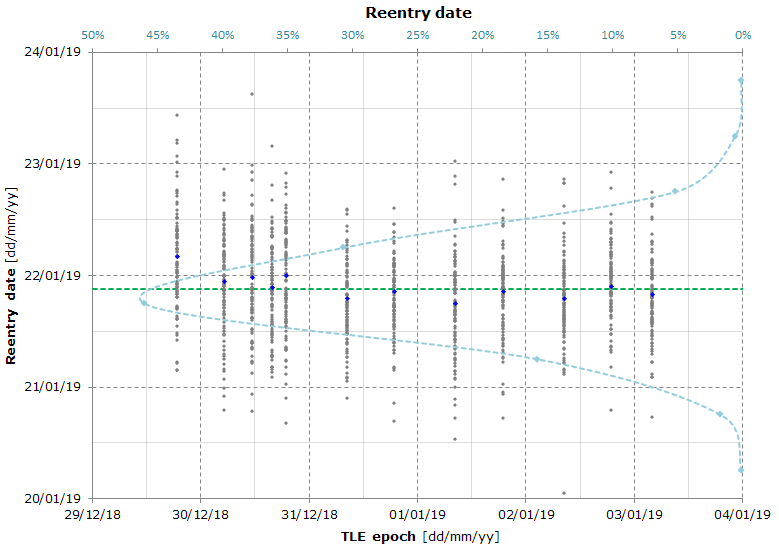
The graph is the result of a Monte Carlo simulation used to calculate the reentry date and the reentry location.
The graph shows the predicted reentry location for each Monte Carlo simulation.
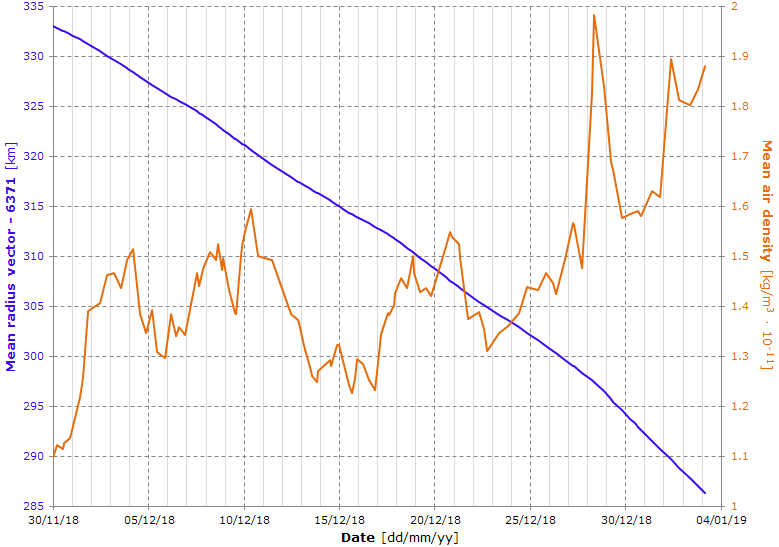
This graph shows the mean radius vector and the mean air density at the satellite position.
The peak in the air density on Dec 28 increased the decay rate and the predicted reentry date is now 1 week earlier than the one obtained from the previous simulation.
Simulation date: 2018-12-17
Atmosphere model: NRLMSISE-00, data file: 2018 Dec 17 10:00:02.14
Gravity model: SGG-UGM-1 truncated to degree and order 15
Reentry date: 2019-01-29.1 ± 2.2 days @ 95% confidence level (2019-01-26.9 ÷ 2019-01-31.2)

The graph is the result of a Monte Carlo simulation used to calculate the reentry date and the reentry location. The graph of the reentry location is not published as it shows a totally random pattern.
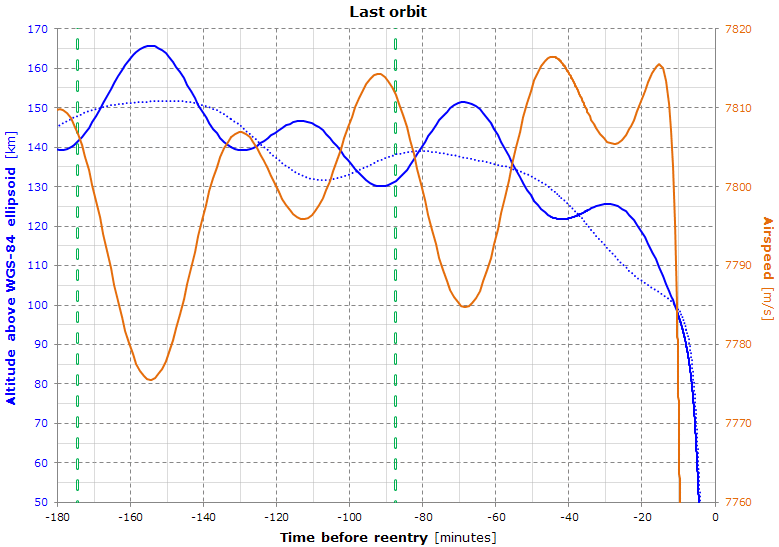
Here's the shape of the predicted last orbit and the corresponding airspeed (corotating atmosphere assumed).
The vertical green lines represent one orbit: the last orbit starts about 87 minutes before reentry and the penultimate orbit starts about 174 minutes before reentry.
The dotted blue plot represents the radius vector minus 6371 km.
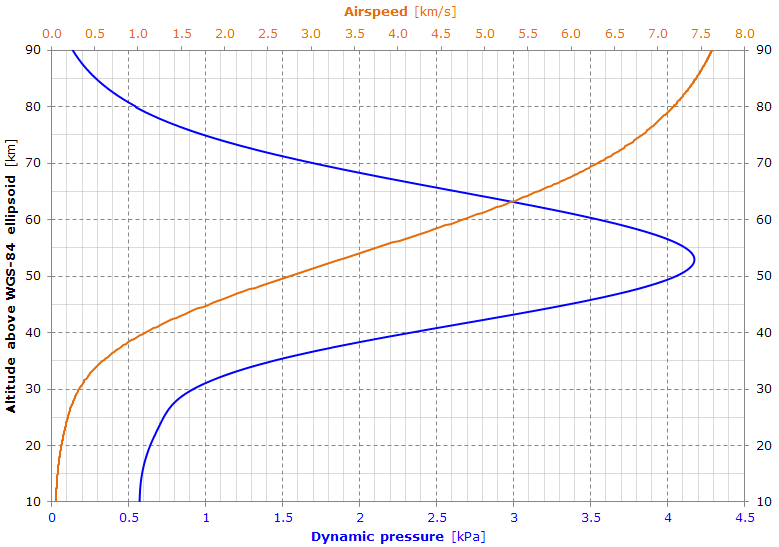
The graph shows a possible reentry profile of the dynamic pressure and satellite airspeed (corotating atmosphere assumed) obtained from the newest TLE.
We can see a relatively small dynamic pressure peak; the reason is that the ballistic coefficient is small (about 52 kg/m
2).
Here is shown the approximate stagnation point heat development during reentry.