logo
Here are some graphs and data related to the OSIRIS-REx mission.

Index

Simulations

- Cruise (2019-11-01)
- Asteroid operations (2020-10-20)
- Post-TAG observation (2021-05-04)
- Final flyby (2021-04-06)
- Sample return (2021-05-19)
- Bennu surface model - v1.4 (2021-03-30)
- Bennu surface model - v1.7 (2021-03-30)
- Launch (2019-02-23)
- DSM-1 and L4 (2019-02-23)
- Earth gravity-assist flyby (2019-03-17)
- DSM-2, AAMs and Bennu (2019-02-23)
- Preliminary survey (2019-08-22)
- Preliminary survey - S/C orientation (2019-08-27)
- Orbital A (2019-12-16)
- Detailed Survey - Baseball Diamond (2019-08-17)
- Detailed Survey - Equatorial Stations (2019-08-17)
- Orbital B - elements (2019-08-04)
- Orbital B (2019-08-19)
- Orbital C - elements (2019-09-24)
- Orbital C (2019-09-24)
- Reconnaissance A (2019-11-02)
- Reconnaissance A - Sites (2019-11-20)
- Orbital R - elements (2020-01-14)
- Orbital R (2020-01-14)
- Reconnaissance B (2020-03-03)
- Reconnaissance C (2020-04-07)
- Checkpoint rehearsal (2020-05-26)
- Recon C - Osprey flyover (2020-06-09)
- TAG rehearsal (Jun/Aug) (2020-08-09)
- Matchpoint rehearsal (2020-09-05)
- Sep - Oct 2020 - elements (2020-10-20)
- Sep - Oct 2020 (2020-10-20)
- TAG sample collection (2020-11-26)
- Post-TAG observation (2021-04-06)
- Post-TAG observation - S/C orientation (2021-04-06)
- Sample return (2021-05-19)


Unless otherwise stated, the following applies.

Data file: graphs and comments are based on NAIF's data files available at naif.jpl.nasa.gov.

Coordinates: the coordinates are geometric (no corrections for aberration, light-time, etc.).

Reference frames: in addition to the well-known frames related to the Earth and to the ecliptic, the following frames are used to better show the asteroid operations: Spacecraft altitude: Bennu is shown in the graphs as an ellipsoid with equatorial radius of 282.365 m and a polar radius of 249.245 m, but the spacecraft altitude is calculated as explained here.

Spacecraft surface speed: some graphs show the spacecraft speed w.r.t. the surface of Bennu. It's calculated as the time derivative of the position of the sub-spacecraft point defined here. To give a familiar example, if instead of Bennu we consider the Earth, that speed is zero for a geostationary satellite.

Maneuvers: here's an example of a table that lists the spacecraft maneuvers:
# Burn time DV Dt a
M1P2018-12-03 17:00:00.000228.328.8877.90
Explanation of the columns: #: name of the maneuver; Burn time: starting UTC burn time; DV: difference between the inertial velocity vector 1 ms before the burn and the inertial velocity vector 1 ms after the burn (mm/s); Dt: burn duration (s); a: average acceleration during the burn (mm/s2, simply a = DV / Dt).
All the values are calculated from the NAIF's data files by means of the SPICE library.

Spacecraft axes: 
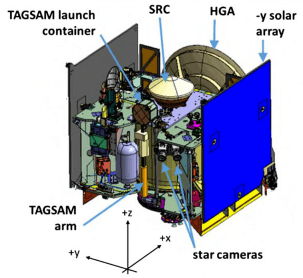
some graphs show the spacecraft orientation according to the figure. Official website page: Spacecraft Coordinate System.
The graphs use the following color convention: the red line is aligned with the +Z axis (during a burn, it represents the direction of the thrust vector when the main engines are used, in other words the propellant is ejected from the main engines in the -Z direction); the blue line is aligned with the +X axis and represents the HGA boresight; the green line is aligned with the +Y axis.

Interactive graphs: almost all the graphs are rendered with plotly.js, an open-source JavaScript graphing library to generate dynamic and interactive graphs. When plotly.js is used, the page could take a few seconds to load.

Accelerations: the spacecraft acceleration during a maneuver is obtained by numerical differentiation of the speed. The formal uncertainty of the acceleration (assuming an exact speed obtained from a data file) is on the order of 10-8 m/s2.


Interesting paper at NASA Technical Reports Server: Maneuver Strategy for OSIRIS-REx Proximity Operations.

Earth Observation Portal link: OSIRIS-REx (Origins, Spectral Interpretation, Resource Identification, and Security‒Regolith Explorer).